Input
Input modules help you load images and metadata into CellProfiler.
Images
The Images module allows you to specify the location of files to be analyzed by the pipeline; setting this module correctly is the first step in creating a new project in CellProfiler. These files can be located on your hard drive, on a networked computer elsewhere, or accessible with a URL. You can also provide rules to specify only those files that you want analyzed out of a larger collection (for example, from a folder containing both images for analysis and non-image files that should be disregarded).
Supports 2D? |
Supports 3D? |
Respects masks? |
|---|---|---|
YES |
YES |
NO |
What is a “digital image”?
A digital image is a set of numbers arranged into a two-dimensional format of rows and columns; a pixel refers to the row/column location of a particular point in the image. Pixels in grayscale or monochrome (black/white) images contain a single intensity value, whereas in color images, each pixel contains a red, green, and blue (RGB) triplet of intensity values. Additionally, the term image can be used as short-hand for an image sequence, that is, an image collection such as a time-lapse series (2-D + t), confocal Z-stacks (3-D), etc.
CellProfiler can read a wide variety of image formats by using a library called Bio-Formats; see here for the formats available. Some image formats are better than others for use in image analysis. Some are “lossy” (information is lost in the conversion to the format) like most JPG/JPEG files; others are “lossless” (no image information is lost). For image analysis purposes, a lossless format like TIF or PNG is recommended.
What do I need as input?
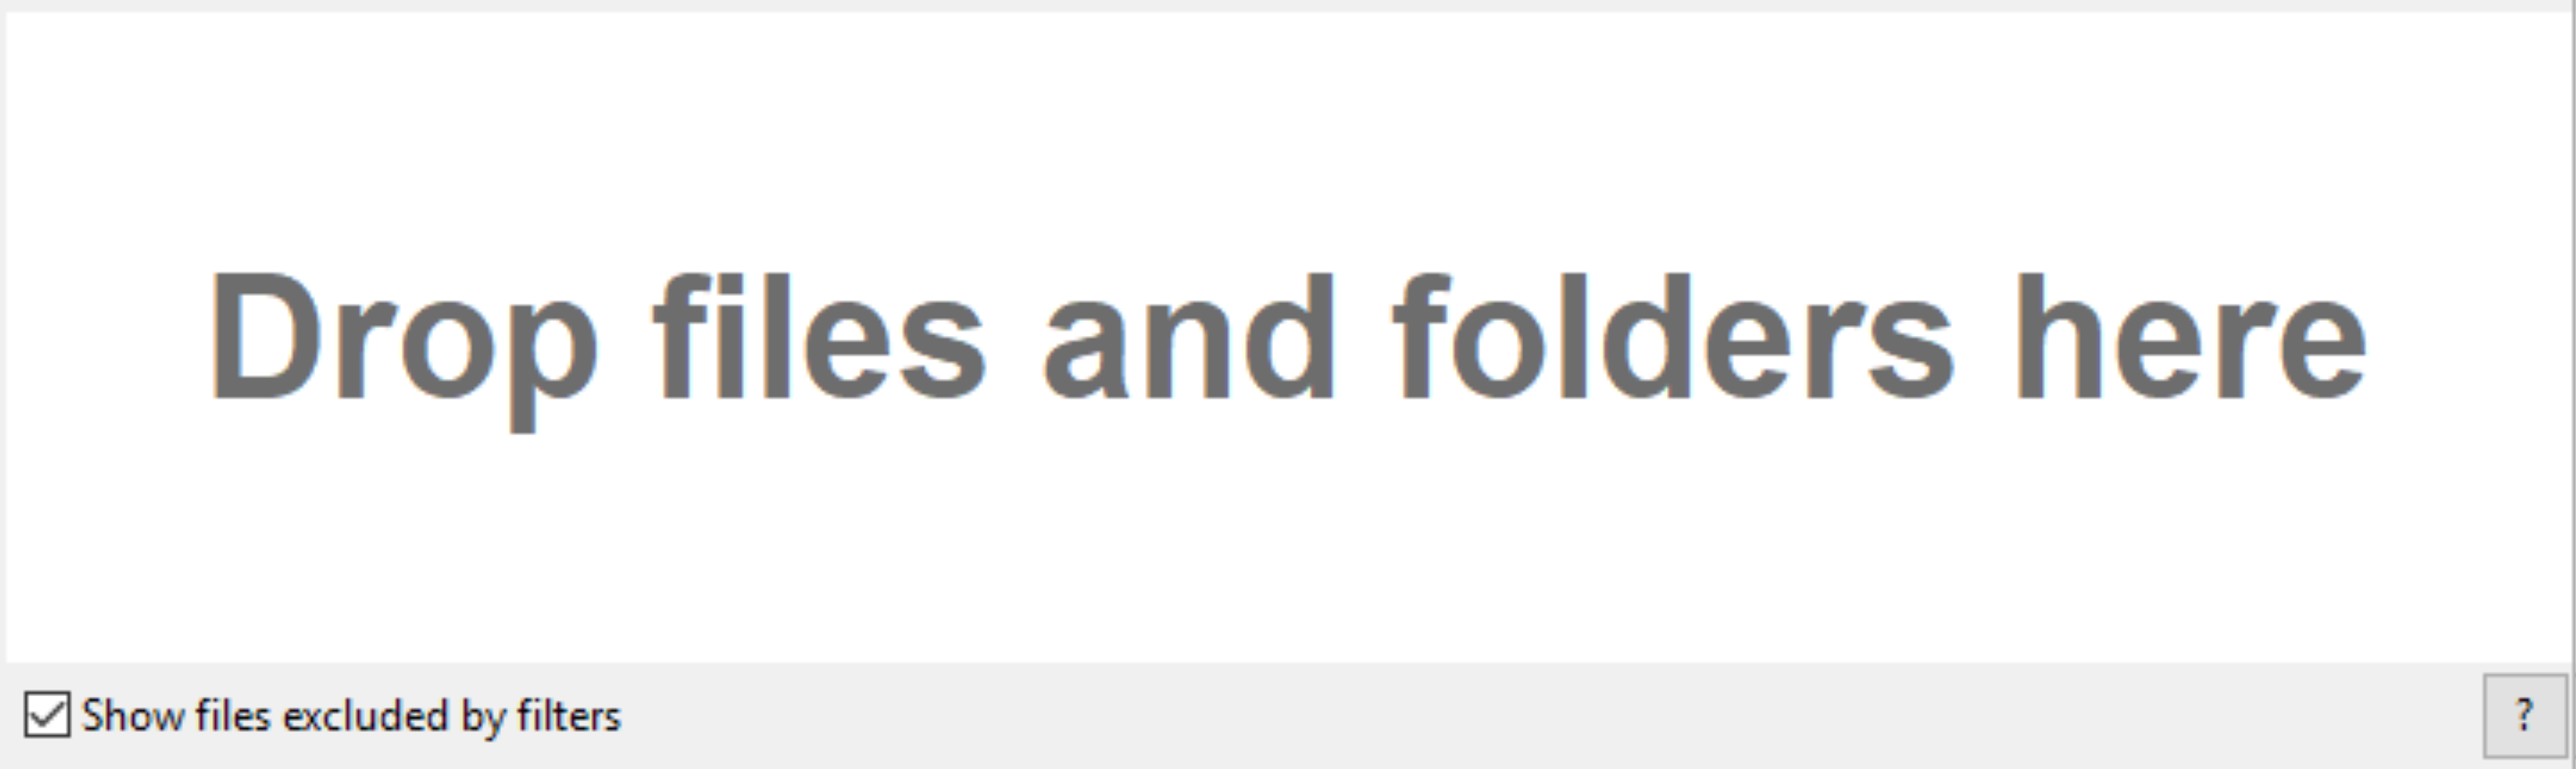
The most straightforward way to provide image files to the Images module is to simply drag-and-drop them on the file list panel (the blank space indicated by the text “Drop files and folders here”).
Using the file explorer tool of your choice (e.g., Explorer in Windows, Finder in Mac), you can drag-and-drop individual files and/or entire folders into this panel. You can also right-click in the File list panel to bring up a file selection window to browse for individual files; on the Mac, folders can be drag-and-dropped from this window and you can select multiple files using Ctrl-A (Windows) or Cmd-A (Mac).
Right-clicking on the file list panel will provide a context menu with options to modify the file list:
Show Selected Image: Selecting this option (or double-clicking on the file) will open the image in a new window.
Remove From List: Removes the selected file or folder from the list. Note that this does not remove the file/folder from the hard drive.
Remove Unavailable Files: Refresh the list by checking for existence of file. Note that this does not remove the files from the hard drive.
Browse For Images: Use a dialog box to select an image file (though drag-and-drop is recommended).
Refresh: Shown only if folder is selected. Refresh the list of files from the folder. Files that were manually removed from the list for that folder are restored.
Expand All Folders: Expand all trees shown in the file list panel.
Collapse All Folders: Collapse all folder trees shown in the file list panel.
Clear File List: Remove all files/folders in the file list panel. You will be prompted for confirmation beforehand. Note that this does not remove the files from the hard drive.
How do I configure the module?
If you have a subset of files that you want to analyze from the full listing shown in the panel, you can filter the files according to a set of rules. This is useful in cases such as:
You have dragged a folder of images onto the file list panel, but the folder contains images you want to analyze along with non-image files that you want to disregard.
You have dragged a folder of images onto the file list panel, but the folder contains the images from one experiment that you want to process along with images from another experiment that you want to ignore for now.
You may specify as many rules as necessary to define the desired list of images.
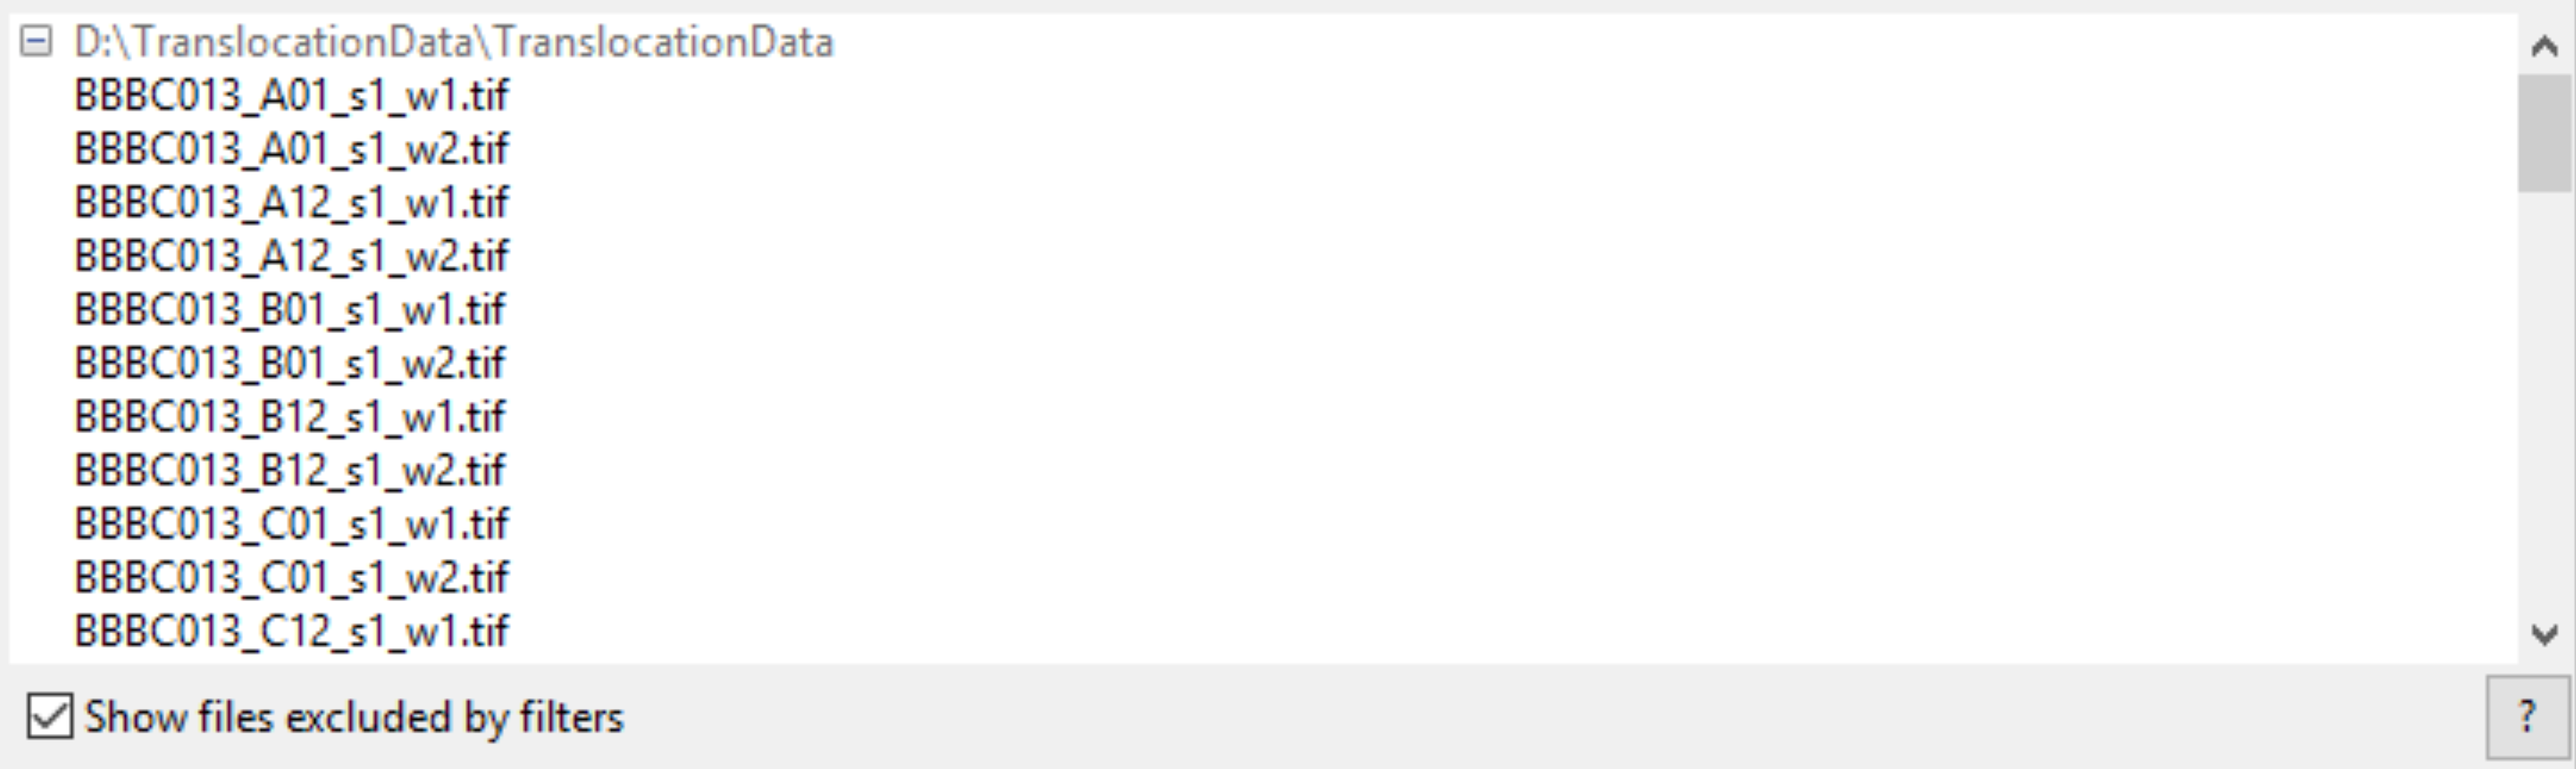
After you have filtered the file list, press the “Apply” button to update the view of the file list. You can also toggle the “Show file excluded by filters” box to modify the display of the files:
Checking this box will show all the files in the list, with the files that have been filtered out shown as grayed-out entries.
Not checking this box will only show the files in the list that pass the filter(s).
What do I get as output?
The final product of the Images module is a file list in which any files that are not intended for further processing have been removed, whether manually or using filtering. This list will be used when collecting metadata (if desired) and when assembling the image sets in NamesAndTypes. The list can be filtered further in NamesAndTypes to specify, for example, that a subset of these images represents a particular wavelength.
Metadata
The Metadata module allows you to extract and associate metadata with your images. The metadata can be extracted from the image file itself, from a part of the file name or location, and/or from a text file you provide.
Supports 2D? |
Supports 3D? |
Respects masks? |
|---|---|---|
YES |
YES |
NO |
What is “metadata”?
The term metadata refers to “data about data.” For many assays, metadata is important in the context of tagging images with various attributes, which can include (but is not limited to) items such as the following:
The row and column of the microtiter plate that the image was acquired from.
The experimental treatment applied to the well that the image was acquired from.
The number of timepoints or channels contained in the image file.
The image type, i.e., RGB, indexed or separate channels.
The height and width of an image, in pixels.
It can be helpful to inform CellProfiler about certain metadata in order to define a specific relationship between the images and the associated metadata. For instance:
You want images with a common tag to be matched together so they are processed together during the pipeline run. E.g., the filenames for fluorescent DAPI and GFP images contain different tags indicating the wavelength but share ‘_s1’ in the filename if they were acquired from site #1, ‘_s2’ from site #2, and so on.
You want certain information attached to the output measurements and filenames for annotation or sample-tracking purposes. E.g., some images are to be identified as acquired from DMSO treated wells, whereas others were collected from wells treated with Compound 1, 2,… and so forth.
The underlying assumption in matching metadata values to image sets is that there is an exact pairing (i.e., a one-to-one match) for a given combination of metadata tags. A common example is that for a two-channel microtiter plate assay, the values of the plate, well, and site tags from one channel get matched uniquely to the plate, well, and site tag values from the other channel.
What are the inputs?
If you do not have metadata that is relevant to your analysis, you can leave this module in the default “No” setting, and continue on to the NamesAndTypes module If you do have relevant metadata, the Metadata module receives the file list produced by the Images module. It then associates information to each file in the file list, which can be obtained from several sources:
From the image file name or location (e.g., as assigned by a microscope). In this case, you will provide the text search pattern to obtain this information.
In a text file created and filled out by you or a laboratory information management system. In this case, you will point the module to the location of this file.
In the image file itself.
You can extract metadata from all images loaded via the Images module, or a subset of them by using rules to filter the list.
What do I get as output?
The final product of the Metadata module is a list of files from the Images module, accompanied by the associated metadata retrieved from the source(s) provided and matched to the desired images.
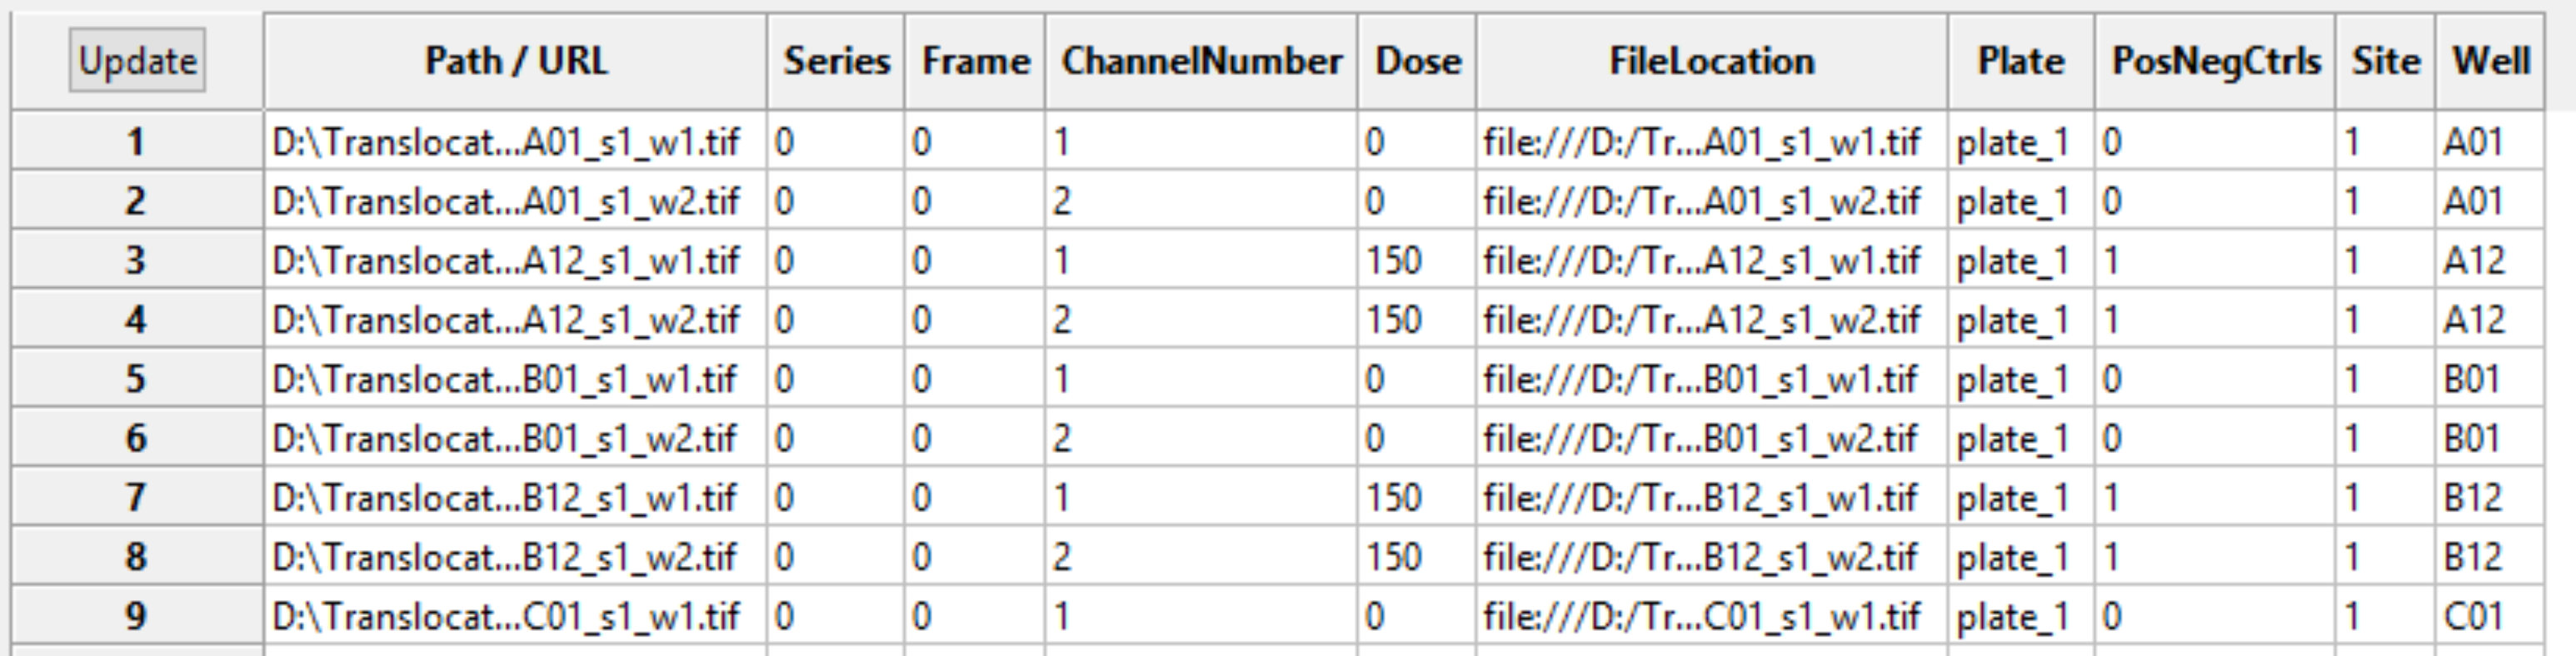
As you are extracting metadata from your various sources, you can click the “Update” button below the divider to display a table of results using the current settings. Each row corresponds to an image file from the Images module, and the columns display the metadata obtained for each tag specified. You can press this button as many times as needed to display the most current metadata obtained.
Some downstream use cases for metadata include the following:
If the metadata establishes how channels are related to one another, you can use them in the NamesAndTypes module to aid in creating an image set.
If the images need to be further sub-divided into groups of images that share a common metadata value, the Groups module can be used to specify which metadata is needed for this purpose.
You can also use the numerical values of pieces of metadata in later modules. Since the metadata is stored as an image measurement and can be assigned as an integer or floating-point number, any module which allows measurements as input can make use of it.
Several modules are also capable of using metadata for more specific purposes. Refer to the module setting help for additional information on how to use them in the context of the specific module.
If the metadata originates from an external source such as a CSV, there are some caveats in the cases when metadata is either missing or duplicated for the referenced images; see the NamesAndTypes module for more details.
Measurements made by this module
Metadata: The prefix of each metadata tag in the per-image table.
NamesAndTypes
The NamesAndTypes module gives images and/or channels a meaningful name to a particular image or channel, as well as defining the relationships between images to create an image set. This module will also let you define whether an image stack should be processed as sequential 2D slices or as a whole 3D volume.
Once the relevant images have been identified using the Images module (and/or has had metadata associated with the images using the Metadata module), the NamesAndTypes module gives each image a meaningful name by which modules in the analysis pipeline will refer to it.
Supports 2D? |
Supports 3D? |
Respects masks? |
|---|---|---|
YES |
YES |
YES |
What is an “image set”?
An image set is the collection of channels that represent a single field of view. For example, a fluorescent assay may have samples using DAPI and GFP to label separate cellular sub-compartments (see figure below), and for each site imaged, one DAPI (left) and one GFP image (right) is acquired by the microscope. Sometimes, the two channels are combined into a single color images and other times they are stored as two separate grayscale images, as in the figure.
|
|
For the purposes of analysis, you want the DAPI and GFP image for a given site to be loaded and processed together. Therefore, the DAPI and GFP image for a given site comprise an image set for that site.
What do I need as input?
The NamesAndTypes module receives the file list produced by the Images module. If you used the Metadata module to attach metadata to the images, this information is also received by NamesAndTypes and available for its use.
How do I configure the module?
In the above example, the NamesAndTypes module allows you to assign each of these channels a unique name, provided by you. All files of a given channel will be referred to by the chosen name within the pipeline, and the data exported by the pipeline will also be labeled according to this name. This simplifies the bookkeeping of your pipeline and results by making the input and output data more intuitive: a large number of images are referred to by a small collection of names, which are hopefully easier for you to recognize.
The most common way to perform this assignment is by specifying the pattern in the filename which the channel(s) of interest have in common. This is done using user-defined rules in a similar manner to that of the Images module; other attributes of the file may also be used. If you have multiple channels, you then assign the relationship between channels. For example, in the case mentioned above, the DAPI and GFP images are named in such a way that it is apparent to the researcher which is which, e.g., “_w2” is contained in the file for the DAPI images, and “_w1” in the file name for the GFP images.
You can also use NamesAndTypes to define the relationships between images. For example, if you have acquired multiple wavelengths for your assay, you will need to match the channels to each other for each field of view so that they are loaded and processed together. This can be done by using their associated metadata. If you would like to use the metadata-specific settings, please see the Metadata module or Help > General help > Using Metadata in CellProfiler for more details on metadata usage and syntax.
What do I get as output?
The NamesAndTypes module is the last of the required input modules. After this module, you can choose any of the names you defined from a drop-down list in any downstream analysis module which requires an image as input. If you defined a set of objects using this module, those names are also available for analysis modules that require an object as input.
In order to see whether the images are matched up correctly to form the image sets you would expect, press the “Update” button below the divider to display a table of results using the current settings. Each row corresponds to a unique image set, and the columns correspond to the name you specified for CellProfiler to identify the channel. You can press this button as many times as needed to display the most current image sets obtained. When you complete your pipeline and perform an analysis run, CellProfiler will process the image sets in the order shown.

Measurements made by this module
FileName, PathName: The prefixes of the filename and location, respectively, of each image set written to the per-image table.
ObjectFileName, ObjectPathName: (For used for images loaded as objects) The prefixes of the filename and location, respectively, of each object set written to the per-image table.
Groups
The Groups module organizes sets of images into groups.
Once the images have been identified with the Images module, have had metadata associated with them using the Metadata module, and have been assigned names by the NamesAndTypes module, you have the option of further sub-dividing the image sets into groups that share a common feature. Some downstream modules of CellProfiler are capable of processing groups of images in useful ways (e.g., object tracking within a set of images comprising a time series, illumination correction within a set of images comprising an experimental batch, data export for a set of images comprising a plate).
Supports 2D? |
Supports 3D? |
Respects masks? |
|---|---|---|
YES |
YES |
NO |
What is an image “group”?
The key to understanding why grouping may be necessary is that CellProfiler processes the input images sequentially and in the order given by the NamesAndTypes module. If you have multiple collections (or “groups”) of images that should be processed independently from each other, CellProfiler will simply finish processing one collection and proceed to the next, ignoring any distinction between them unless told otherwise via the Groups module.
To illustrate this idea, below are two examples where the grouping concept can be useful or important:
If you have time-lapse movie data that is in the form of individual image files, and you are performing object tracking, it is important to indicate to CellProfiler that the end of a movie indicates the end of a distinct data set. Without doing so, CellProfiler will simply take the first frame of the next movie as a continuation of the previous one. If each set of files that comprise a movie is defined using the Metadata module, the relevant metadata can be used in this module to insure that object tracking only takes place within each movie.
If you are performing illumination correction for a screening experiment, we recommend that the illumination function (an image which represents the overall background fluorescence) be calculated on a per-plate basis. Since the illumination function is an aggregate of images from a plate, running a pipeline must yield a single illumination function for each plate. Running this pipeline multiple times, once for each plate, will give the desired result but would be tedious and time-consuming. In this case, CellProfiler can use image grouping for this purpose; if plate metadata can be defined by the Metadata module, grouping will enable you to process images that have the same plate metadata together.
What are the inputs?
Using this module assumes that you have already adjusted the following Input modules:
Used the Images module to produce a list of images to analyze.
Used the Metadata module to produce metadata defining the distinct sub-divisions between groups of images.
Used the NamesAndTypes module to assign names to individual channels and create image sets.
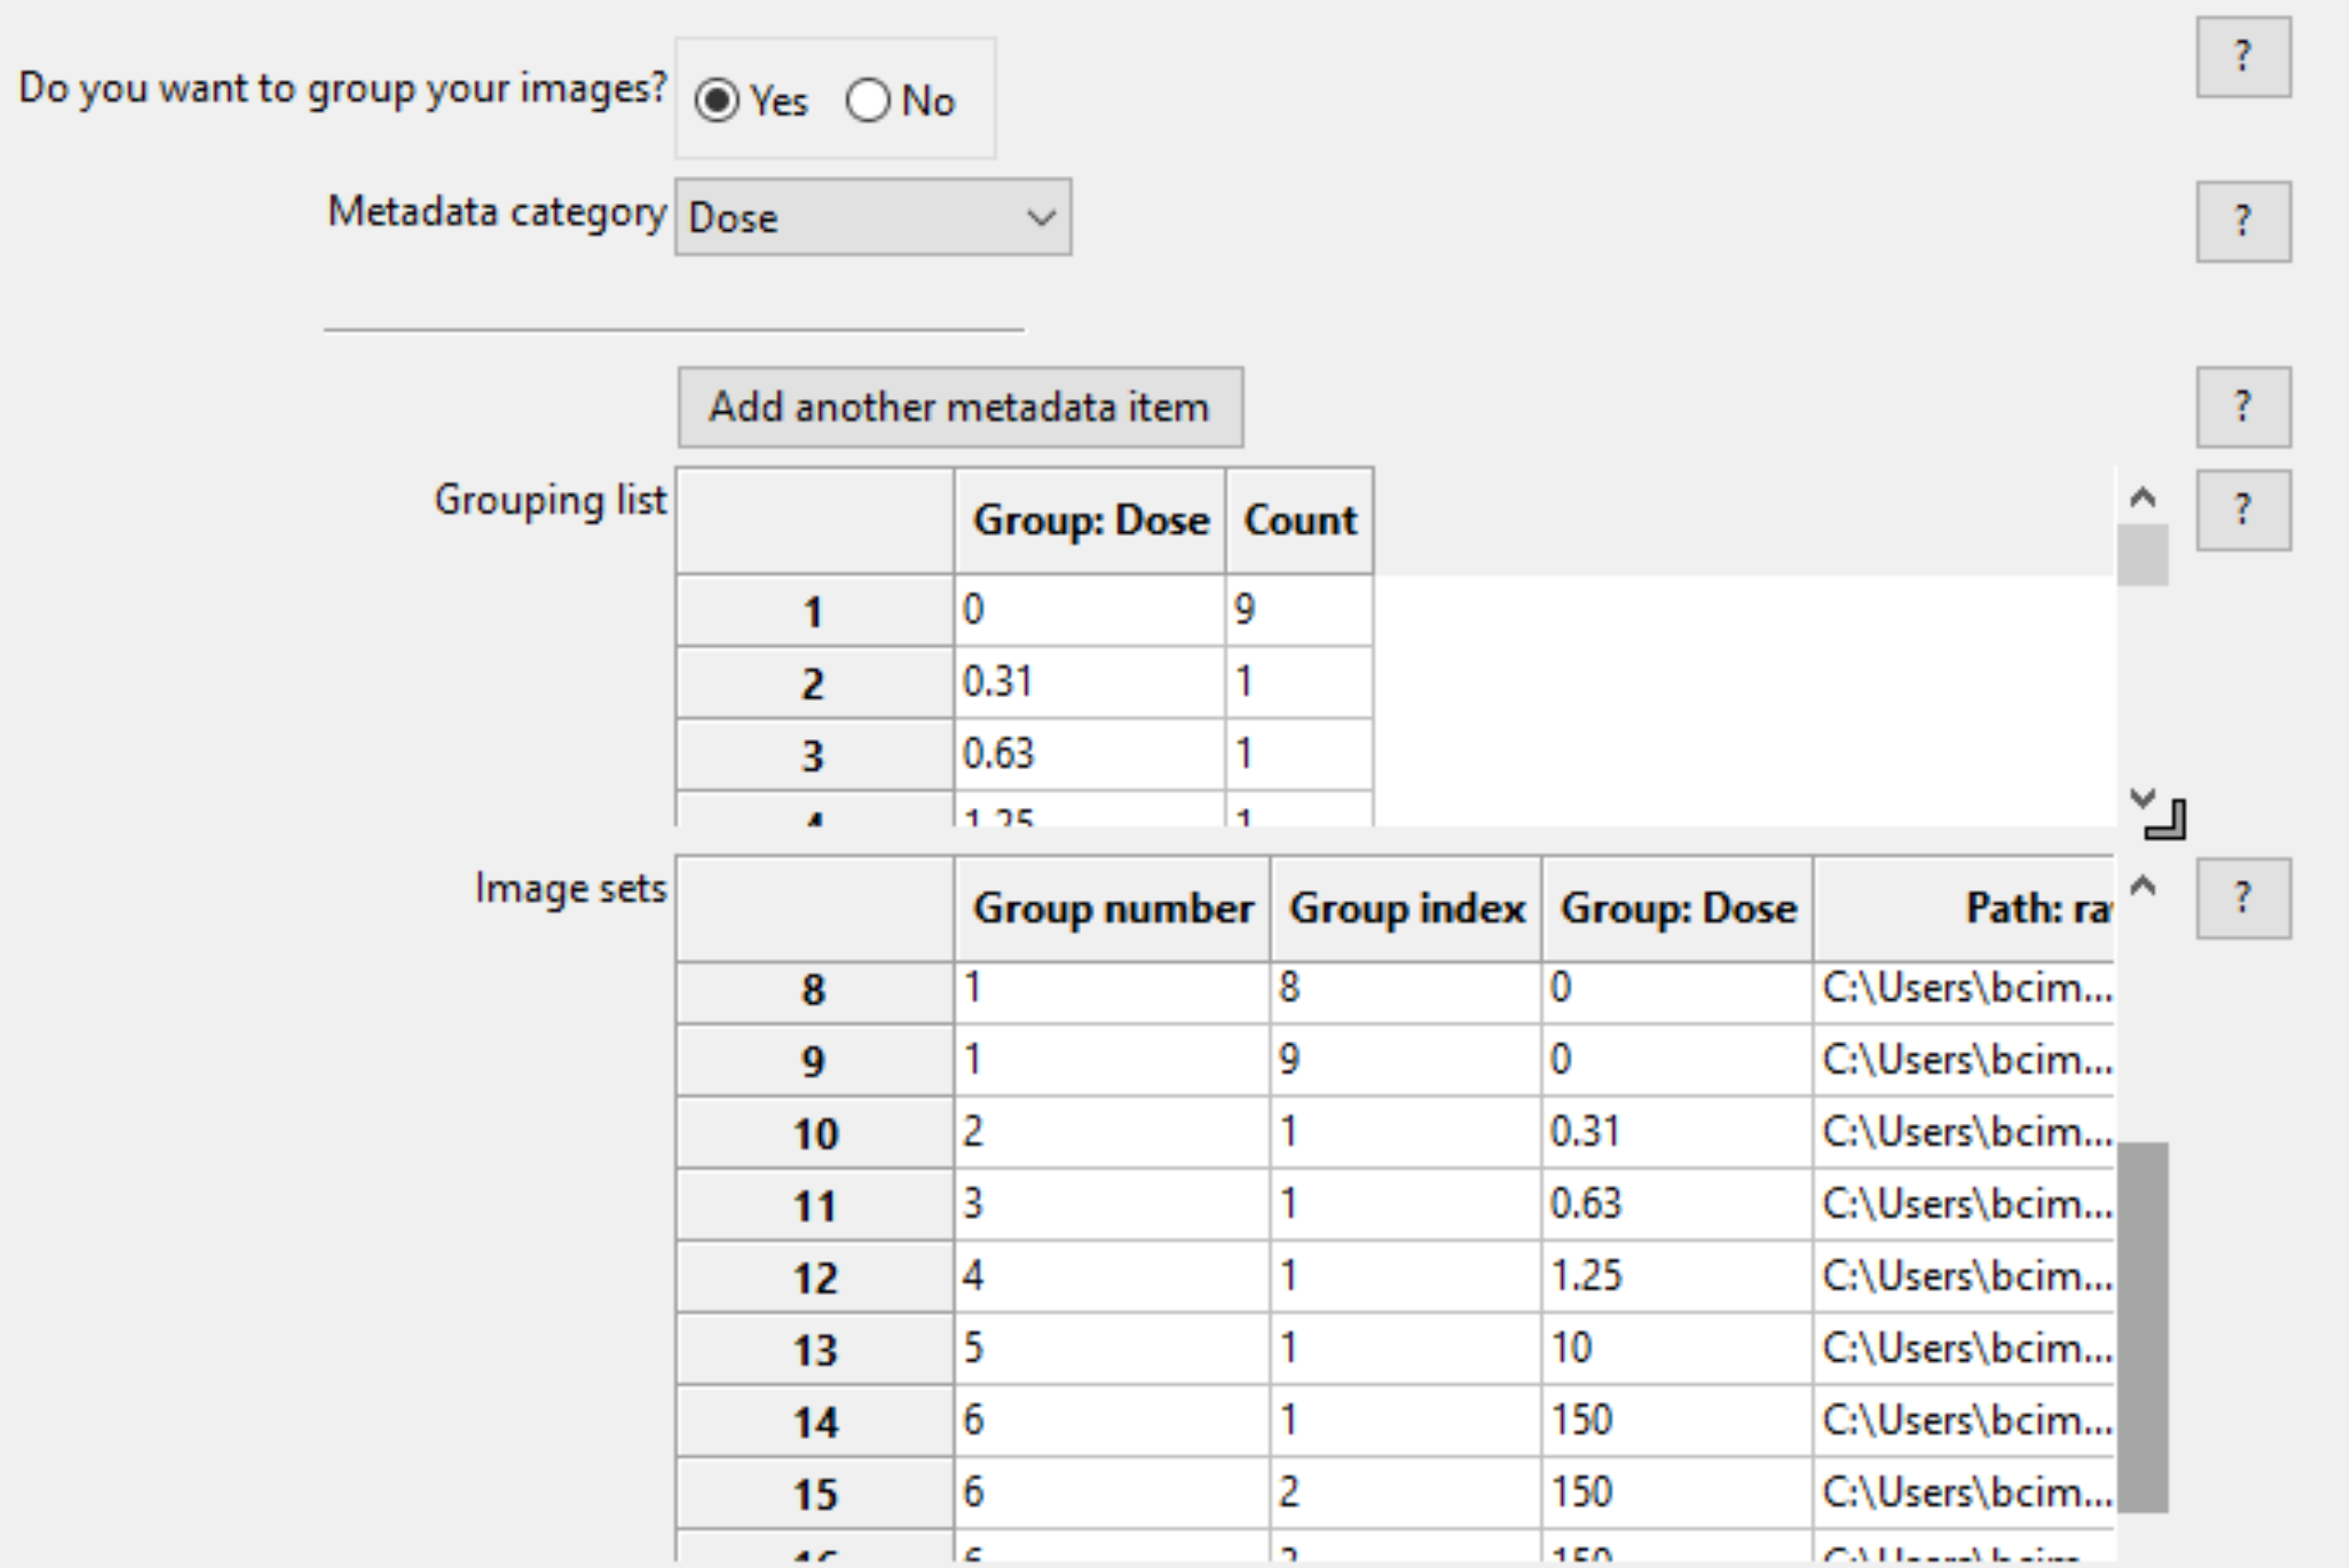
Selecting this module will display a panel, allowing you to select whether you want to create groups or not. A grouping may be defined as according to any or as many of the metadata categories as defined by the Metadata module. By selecting a metadata tag from the drop-down for the metadata category, the Groups module will sub-divide and assemble the image sets according to their unique metadata value. Upon adding a metadata category, the two tables underneath will update to show the resultant organization of the image sets for each group.
What do I get as output?
The final product of the Groups module is a list defining subsets of image sets that will be processed independently of the other subsets.
If no groups are defined, the Analysis modules in the rest of the pipeline will be applied to all images in exactly the same way.
If groups are defined in the Groups module, then organizationally (and transparently to you), CellProfiler will begin the analyses with the first image set of the group, end with the last image set of the group, and then proceed to the next group.
The two tables at the bottom provide the following information when a metadata category is selected:
The grouping list (top table) shows the unique values of the selected metadata under the “Group” column; each of the unique values comprises a group. The “Count” column shows the number of image sets included in a given group; this is useful as a “sanity check” to make sure that the expected numbers of images are present.
The image set list (bottom table) shows the file name and location of each of the image sets that comprise the groups.
Measurements made by this module
Group_Number: The index of each grouping, as defined by the unique combinations of the metadata tags specified. These are written to the per-image table.
Group_Index: The index of each image set within each grouping, as defined by the Group_Number. These are written to the per-image table.
Technical notes
To perform grouping, only one analysis worker (i.e., copy of CellProfiler) will be allocated to handle each group. This means that you may have multiple workers created (as set under the Preferences), but only a subset of them may actually be active, depending on the number of groups you have.